
If you’re not familiar with Google Analytics, when you first login, it can seem a bit overwhelming! Don’t sweat it, though. We’re here to help.
Over the next couple of months, we’re going to breakdown some of the more important reports within Google Analytics one-at-a-time to help you get the most out of this valuable tool.
Not sure if your website is using Google Analytics? Let us know in the comments and someone from our team will reach out to help you get to the bottom of it! Okay, now let’s take a look at our first report.
Default Channel Groupings
The Default Channel Groupings report within Google Analytics is a great place to start. It breaks down where your website’s traffic is coming from and places it into one of these categories:
- Direct: A visitor opened up their web browser and simply typed in your website’s URL directly into their address bar, without firs performing a search via a search engine like Google.
- Organic Search: A visitor performed a search within Google, Bing, Yahoo, or some other search engine and clicked a link from the SERPs (Search Engine Results Pages) that lead them to your website.
- Paid Search: Traffic generated via PPC campaigns, like those that can be configured via Google’s Ads platform.
- Social: A traffic generated from a link posted on a social media website like Facebook or LinkedIn.
- Referral: Traffic generated when a user clicks on a link to your website that was posted on another website – for example, if a user clicked on a link to your website from you local Chamber of Commerce’s website , that visit would count as a “referral” visit.
- Email: Traffic generated as a result of an email marketing campaign.
- Affiliates: Traffic generated via one of your affiliate partners. This is one that you’ll likely see very often.
- Display: Traffic generated as a result of a display advertising campaign (like banner ads, etc).
- Other: A bit of a catch-all for any other traffic source that doesn’t fit into one of the other categories. If you’re noticing that a lot of your traffic falls into this category, it’s worth digging into a bit more as this should only really make up about 1-2% of your traffic (if that).
You can find some additional information on how Google Analytics classifies each visit on their Default Channel Definitions page.
To navigate to this report, once you’re logged in to your insurance agency’s Google Analytics account, click on Acquisition > All Traffic > Channels.
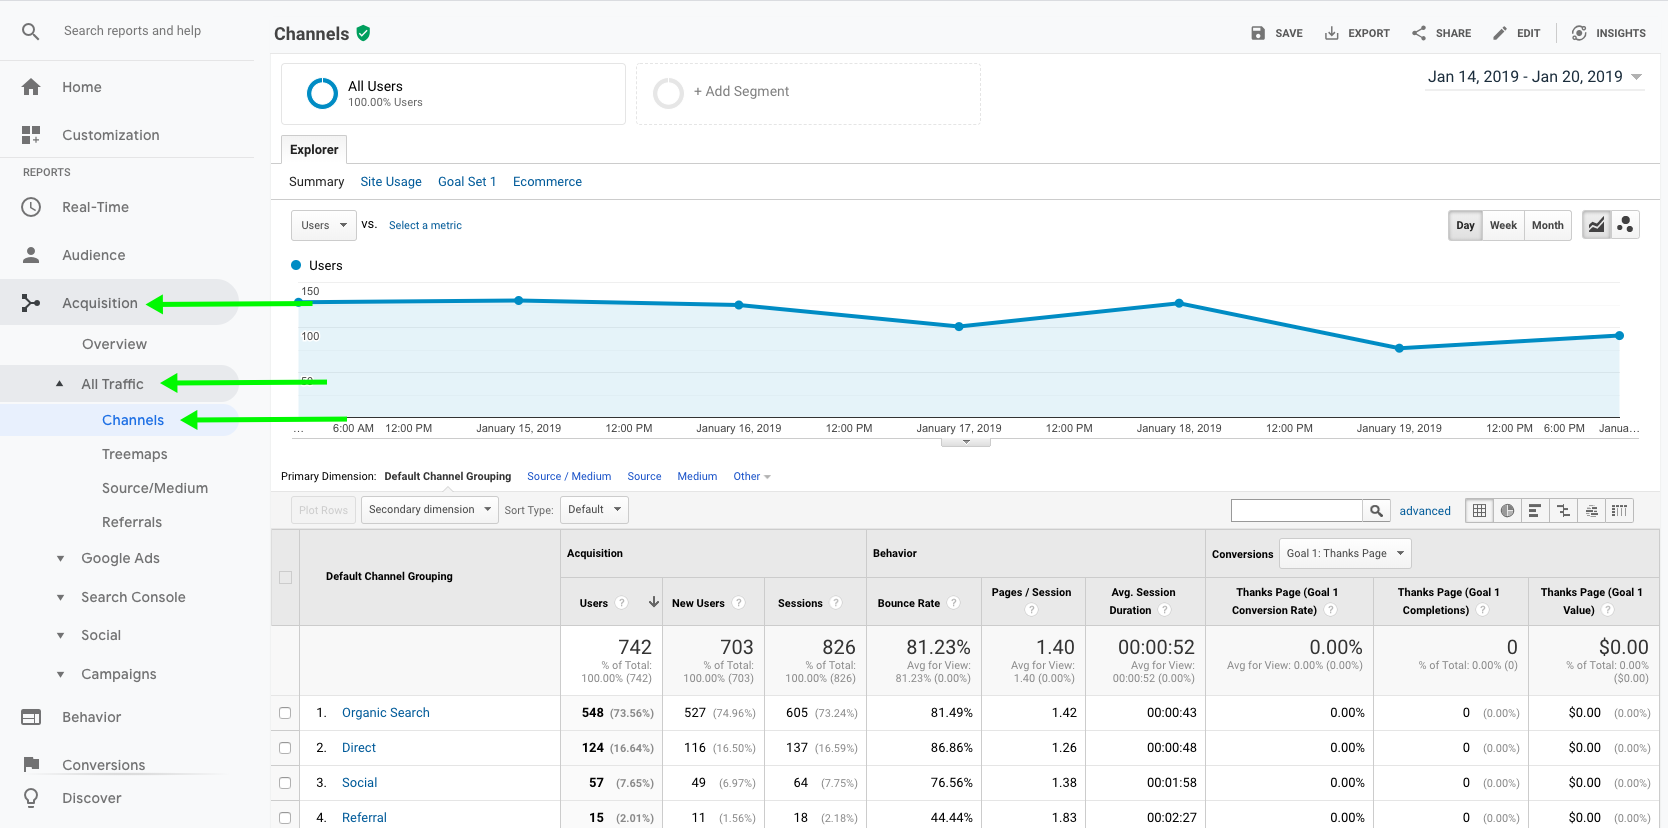
Once the report loads, you’ll be able to see your traffic data segmented out into each of the Default Channel Groupings. The data is broken down into three main categories – Acquisition (who are they and where’d they come from?), Behavior (what’d they do when they got there?), and Conversions (did they perform a desired action – more on this is in a future proof?)
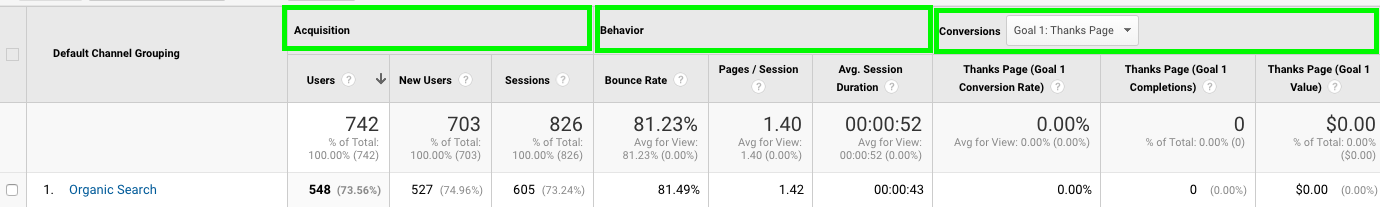
Under Acquisition, you’ll see how many individual users visited your website, how many new users (people who haven’t been to your website before), and how many sessions took place. Think of a session as an individual visit. If a user visits your website today, and than comes back tomorrow, it’ll be counted as 1 user, but 2 sessions.
Under Behavior, you’ll see how many people left your website on the same page that they came in on (Bounce Rate), how many pages per session were viewed, on average, and the average session duration (how long do users spend on your website?).
Under Conversions, you’ll see some data as it relates to goal conversions you may have configured – think of things like form fills, downloads, etc. Again, we’ll cover this more in another post at a later date.
What Can You Do With This Information?
The Default Channel Grouping report is a great way to get a high level overview of where your traffic is coming from and how users from each of the traffic sources interact with your website. You may find that traffic from Organic Search has a longer session duration and views more pages during their visit, whereas users coming from social media tend to have a higher bounce rate. Once you know how where your traffic is coming from and how they’re engaging with your website, you can use that information to make better marketing decisions. For example, if you notice that traffic generated from social media has a higher conversion rate than your other traffic sources, you may want to consider dedicating more resources to that channel.
To get some additional insights into each of these channels, simply click on the name of the Default Channel Grouping. For example, if we click on social, you may see something like the below:
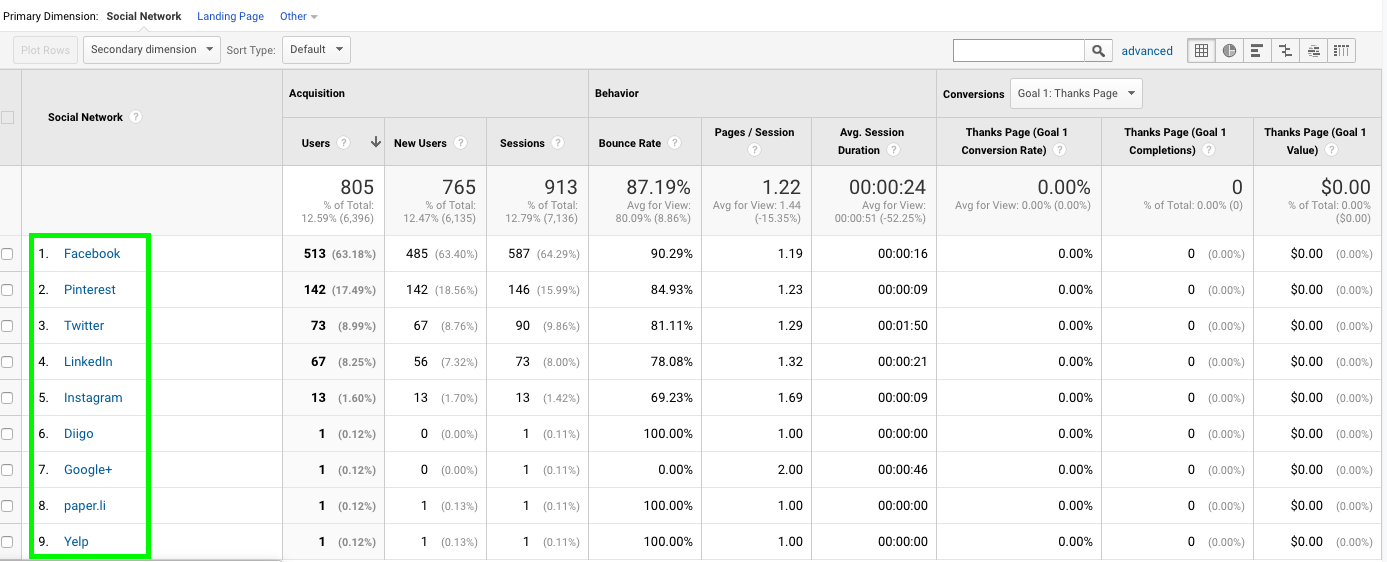
On the left, you’ll see a list of each of the social networks that are driving traffic to your website. You can continue to drill down further by clicking on the name of the individual network. For example, clicking on Facebook, and adding a “secondary dimension of “Landing Page” will show you something like the below.
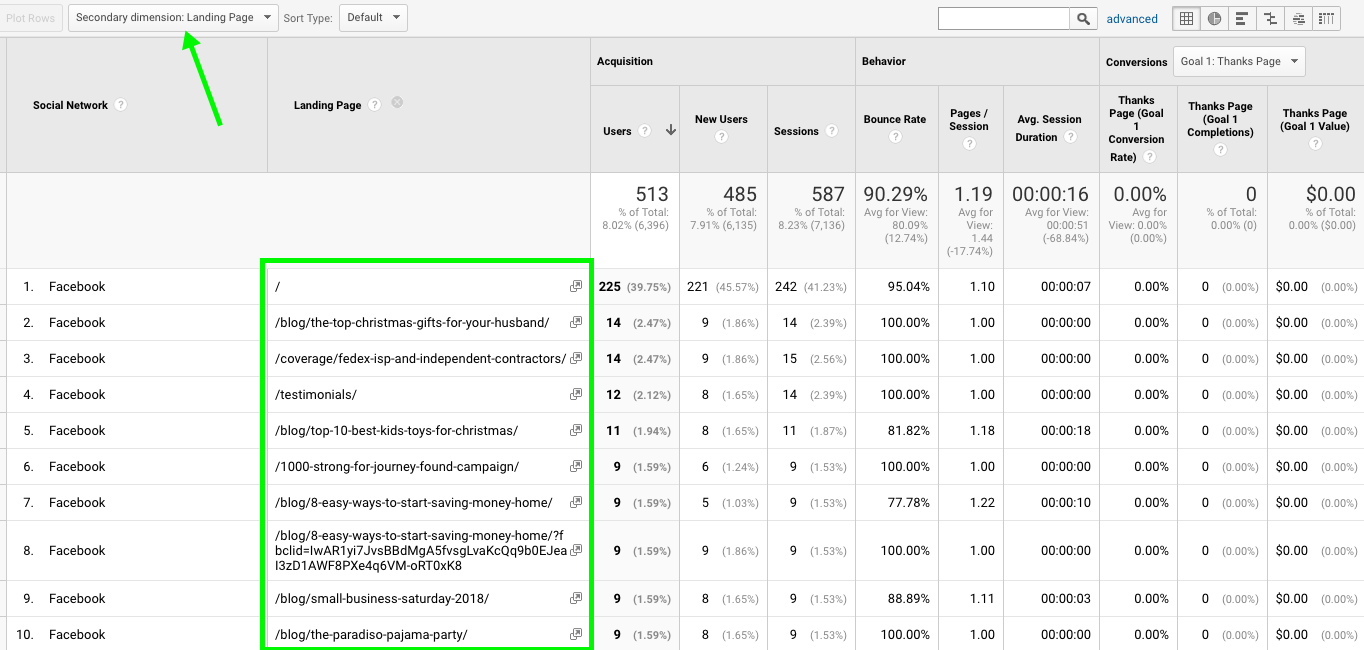
Using this report, you can see which pages on your insurance agency’s website received the most traffic from Facebook – this can help you figure out which pages are most popular with that audience so that you can create more content like it.
The more that you play around in Google Analytics, the more comfortable you’ll become with it – so don’t be intimidated. Just get in there and start taking a look at the reports that are available to you – you may be surprised by how much great information you find.
If you have any questions about Google Analytics, don’t be a stranger! Leave a comment below or contact us.

Eddy DeMelo is the Co-Founder of Agency Appeal and President of Beyond The Bots.